
Dashboards and widgets
Create personal or project dashboards, configure eight widgets and inspect their source results.
Create and share
Open Dashboards, choose Create, set a name and choose personal or project-shared visibility. Personal dashboards belong to their owner. Project members including viewers can read a shared dashboard. Configuration requires ownership; sharing also requires project manager or administrator access.
Favourite a dashboard from its heading or listing to place it under Dashboards in your sidebar. Shared favourites select the project context; personal dashboards are labelled Personal. The last accessible dashboard is remembered without changing the app's normal landing view.
Select a source
Most widgets use a saved query. Personal dashboards may use saved queries accessible to the owner. Shared query widgets require a query shared with that dashboard's project. Shared board widgets require a board including that project.
Access is rechecked when data loads, including the current viewer for currentUser(). A deleted, inaccessible or invalid source shows Source unavailable; it does not fall back to all tickets. Fix the source rather than interpreting an error as zero matching work.
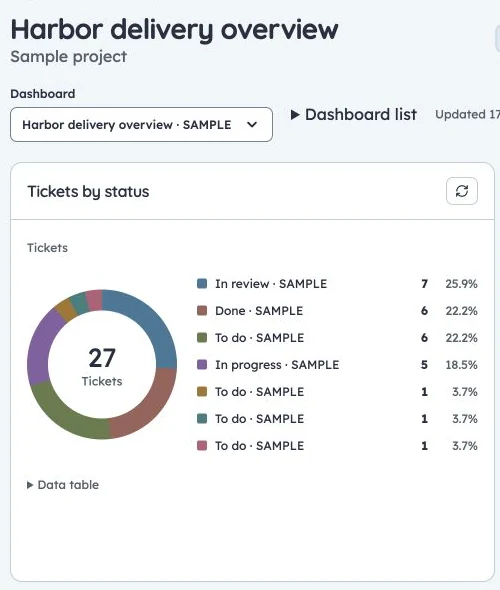
Harbor delivery dashboard
Production Harbor status widget. The capture isolates its counts, legend and data-table control to exclude people labels.
Configure widgets
| Widget | Configuration and interpretation |
|---|---|
| Pie/doughnut | Count tickets by status, type, priority, project, assignee, reporter or a compatible custom single-choice, checkbox or user field; read counts and percentages |
| Bar chart | Group a saved query; measure count, points, original hours or remaining hours |
| Summary number | Count tickets or sum one selected estimate measure |
| Ticket list | Select columns; retain source sorting; show 20 tickets with a link to all results |
| Sprint burndown | Select a Scrum board and active/selected sprint; use recorded baseline/scope and sprint unit |
| Velocity | Select a Scrum board and points/hours; show the last six completed sprints recorded in that unit |
| Created versus completed | Daily UTC counts over 7, 30 or 90 days; reopening removes tickets from the current completed series |
| Aging work | Show unfinished work by oldest update, elapsed days and up to 20 ticket links; open all results for more |
Categorical charts show at most ten named groups, plus Other and Not set. Empty values are not silently dropped. Numeric/date buckets and multiple-choice grouping are not supported. A measure never combines points and hours. Use the accessible data table as an alternative to interpreting chart color.
Harbor configurations
Use a shared All sample tickets query for the overview. Add defects by priority to identify support risk, remaining hours by assignee for workload, and an unassigned-work summary to find ownership gaps. Include burndown and velocity only for the intended Scrum board and unit.
Chart segments and summary numbers open filtered ticket results while preserving the source conditions and permissions. Check those results when investigating an unexpected total. Refresh after changing a source query.
Arrange and save
Edit creates a local configuration draft. Add up to 12 widgets. Desktop uses twelve columns with supported card sizes. Drag to reorder or use keyboard move controls; resize snaps to supported dimensions, with keyboard size controls available.
Mobile stacks cards without rewriting the desktop arrangement. Save commits configuration with a dashboard version; Cancel restores saved settings. Conflicts preserve the newer server configuration rather than silently overwriting it.
Widget data loads on opening and after saving. Use Refresh manually and inspect the last-refreshed time. There is no background polling. A failed widget has its own retry; other widgets can remain useful.